
It’s been 16 years since I started writing for PhoneArena and I still remember writing about the latest Android distribution numbers that were released every month. Ah, those were the days when the Android dessert names were cool like Froyo (Android 2.2), Eclair (Android 2.0), and in cooperation with Nestle, KitKat (Android 4.4). The big issue in those days was the fragmentation of Android which is something that continues to haunt the OS to this day.
Because there are so many different manufacturers of Android phones, each with their own update schedule, this fragmentation means that the latest version of Android isn’t found on a large percentage of Android phones at any given time. After some time, Google stopped releasing the monthly distribution tables before it started on a quarterly release schedule in 2023. The most recent distribution numbers were published at the beginning of the current month and do not include any Samsung models running Android 15.
While Samsung was releasing beta versions of One UI 7 which contained Android 15, as of April 1st Android 15 was found on only 4.5% of Android phones. This figure includes stable Android 15 versions running on compatible Pixel handsets since last October, certain OnePlus, and Nothing handsets. As of April 1st, the majority of Android handsets, 27.4% of them, were powered by Android 14 which was released in October 2023.
The Android distribution numbers are now released once or twice a year via Android Studio and it continues to be based on the OS versions of Android that connect to the Play Store within the previous seven days.
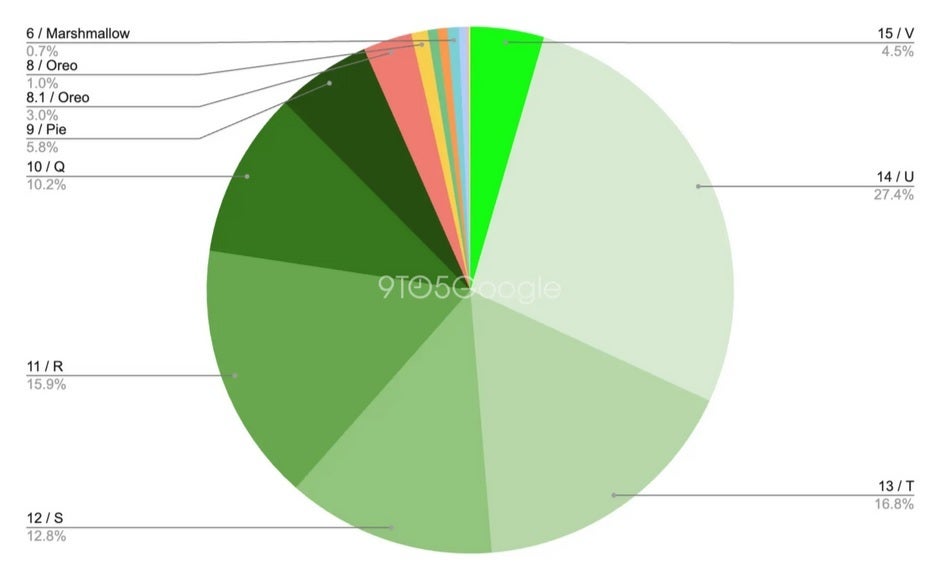
Here are the latest distribution numbers released by Google. You can also check out the pie chart based on the latest numbers below:
- Android 15.0 (V)-4.5%
- Android 14.0 (U)-27.4%
- Android 13.0 (T)-16.8%
- Android 12.0 (S)-13.8%
- Android 11.0 (R)-15.9%
- Android 10.0 (Q)-10.2%
- Android 9.0 (Pie)-5.8%
- Android 8.1 (Oreo)-3.0%
- Android 8.0 (Oreo)-1.0%
- Android 7.1 (Nougat)-0.6%
- Android 7.0 (Nougat)-0.6%
- Android 6.0 (Marshmallow)-0.7%
- Android 5.1 (Lollipop)-0.5%
- Android 5.0 (Lollipop)-0.1%
- Android 4.4 (KitKat)-0.1%
The most recent look at Android distribution as of April 1st. | Image credit-9to5Google
If Android were not fragmented, the most recent release, Android 15, would be found on a higher percentage of phones instead of only 4.5% of them. This June, Google will probably release the stable version of Android 16 for compatible models including the Pixel 6 and older units.
Read the latest from Alan Friedman
Source


")


