


If you have ever felt limited by standard spreadsheet functions when tackling complex datasets, you are in the right place. With a recent Python integration in Excel, Microsoft has enabled the leading language for data science right within your familiar spreadsheet interface. Let me show you how to bridge the gap, bring advanced analytical techniques, custom scripting, and powerful Python libraries directly into your Excel workflow.

Related
Can Python do everything Excel can?
Exploring Python’s capabilities versus Excel
How do I access Python in Excel?

Before I go over the Python tricks in Excel, it’s important to go through the basics first. Python in Excel is available on Windows only. You can’t access it on Mac, web, tablet, or mobile. You can still open your workbooks on other platforms, but such cells may throw an error.
Also, you don’t need to download a native Python app on your desktop. Excel uses a standard version of Python from Microsoft Cloud. As a result, Excel won’t consider any tweaks you make to the local version of Python.
Excel supports a core set of Python libraries provided by Anaconda. You also have the option to import more libraries through Anaconda. Check out the official website to check the entire list of supported Python libraries.
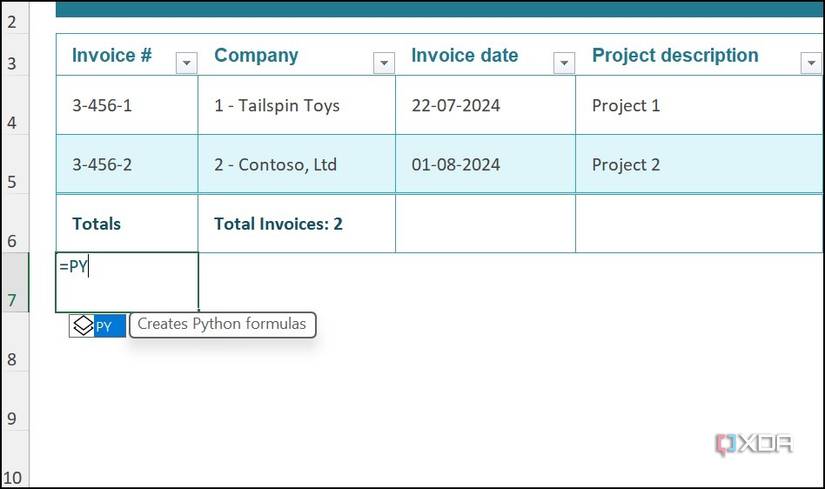
If you are using Excel on Windows, update it to the latest version, and you should find the Insert Python option appearing under the Formulas menu (you can also type =PY in a cell to enable it).

Related
How you can combine Python with Excel to supercharge your spreadsheets
Transform your Excel workflows with Python magic
Send Excel data to Python by creating DataFrame
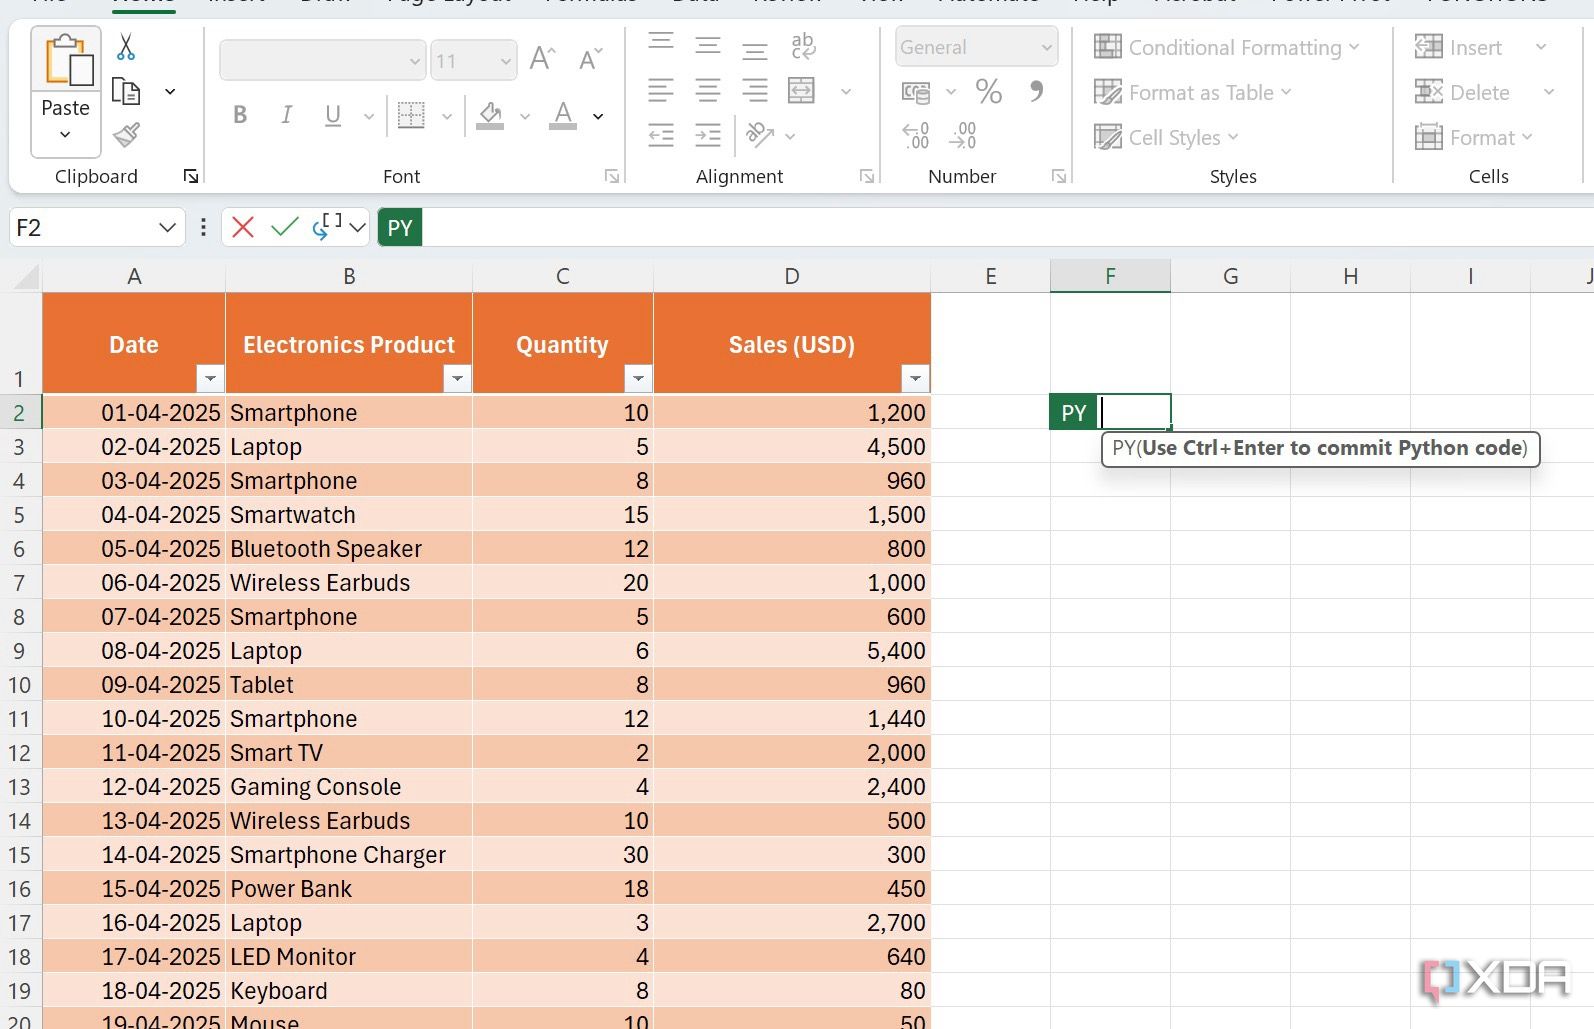
If you are working with data, the first step you need to take is to send your data to Python. After all, it needs to be able to see your data to work with it. We can do that by just referencing the cell.
-
Open your Excel sheet, which contains a database. Select an empty cell and type =PY. Press Tab.
-
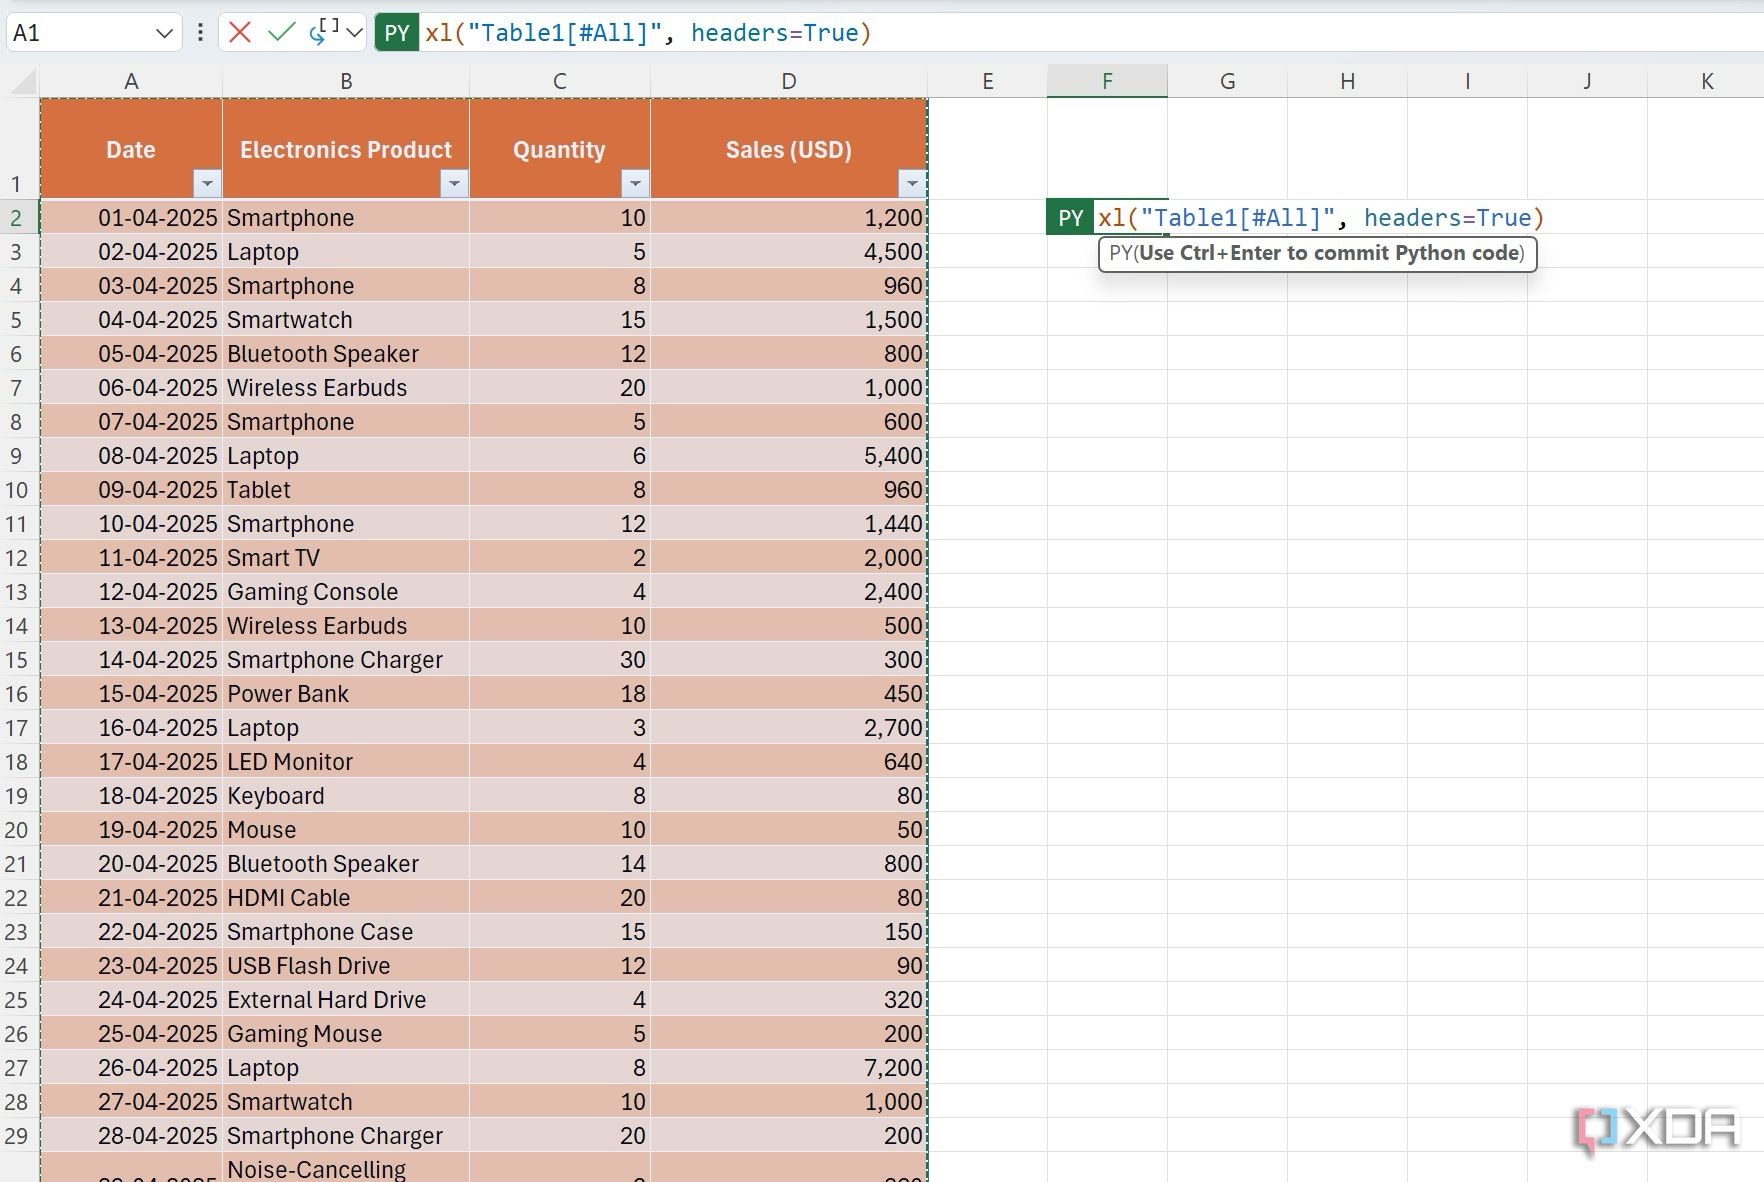
Select your database and check its reference at the top. Keep pressing Enter several times so that you can see your Python scripts (as some of them are often longer and can be hard to read).
-
Press Ctrl + Enter. The condensed version of your table is ready.
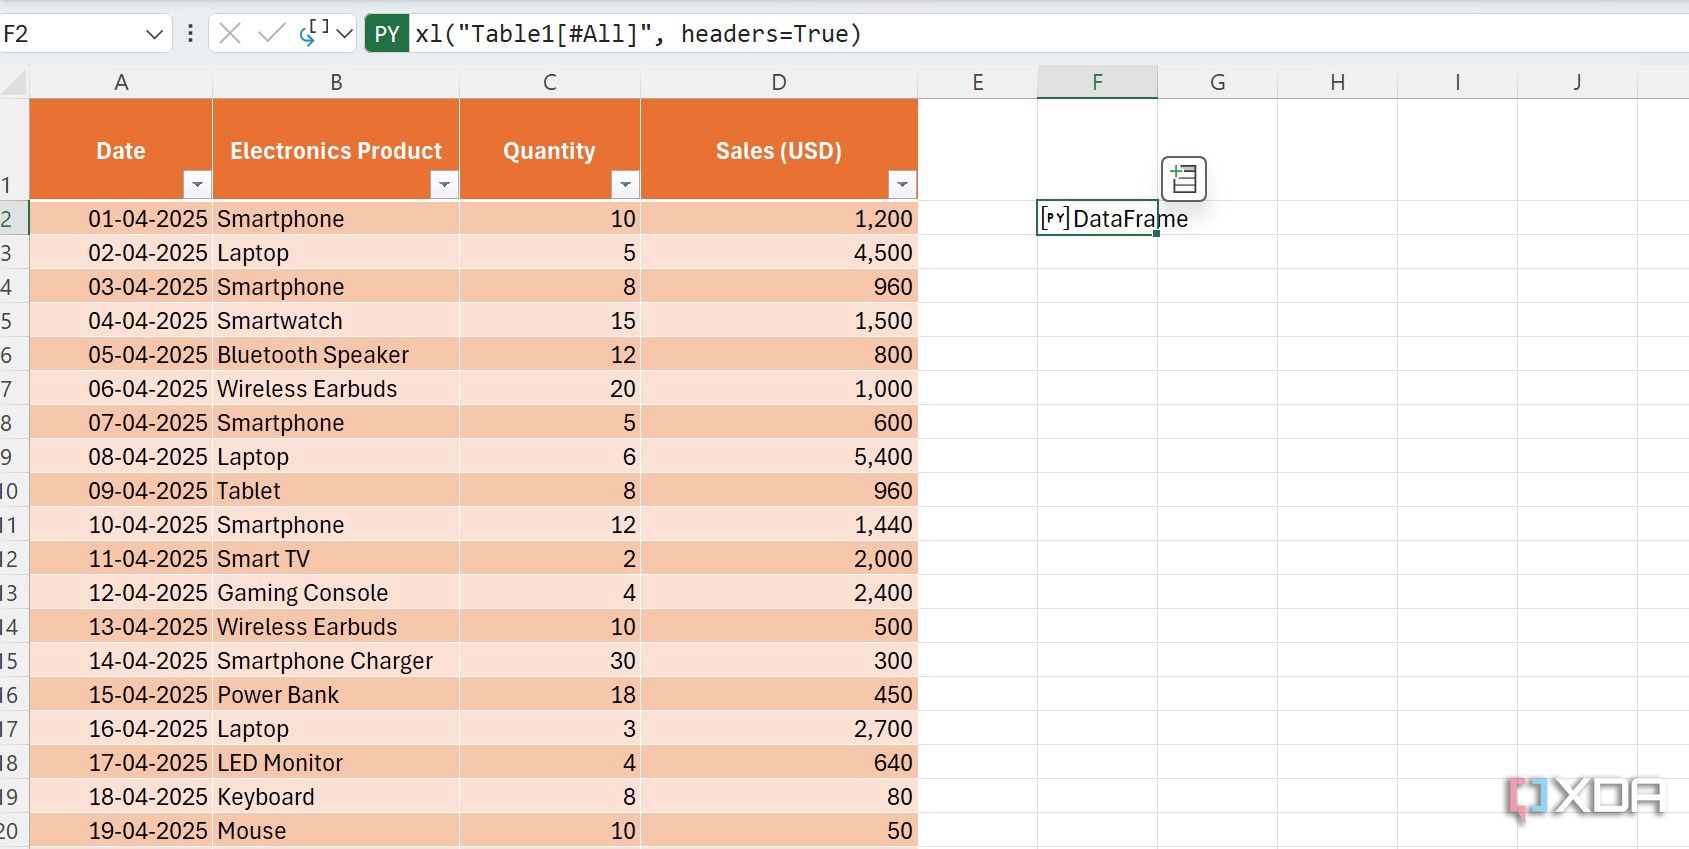


This DataFrame is a fundamental structure of a specific Python library called pandas. It’s ideal for data analytics.
Use Python to describe your database
Now, let’s use a DataFrame to describe your Excel table. It’s quite simple using the describe method.
- Open your Excel sheet, type =PY and hit Tab to enable Python mode (Ctrl + Alt + Shift + P).
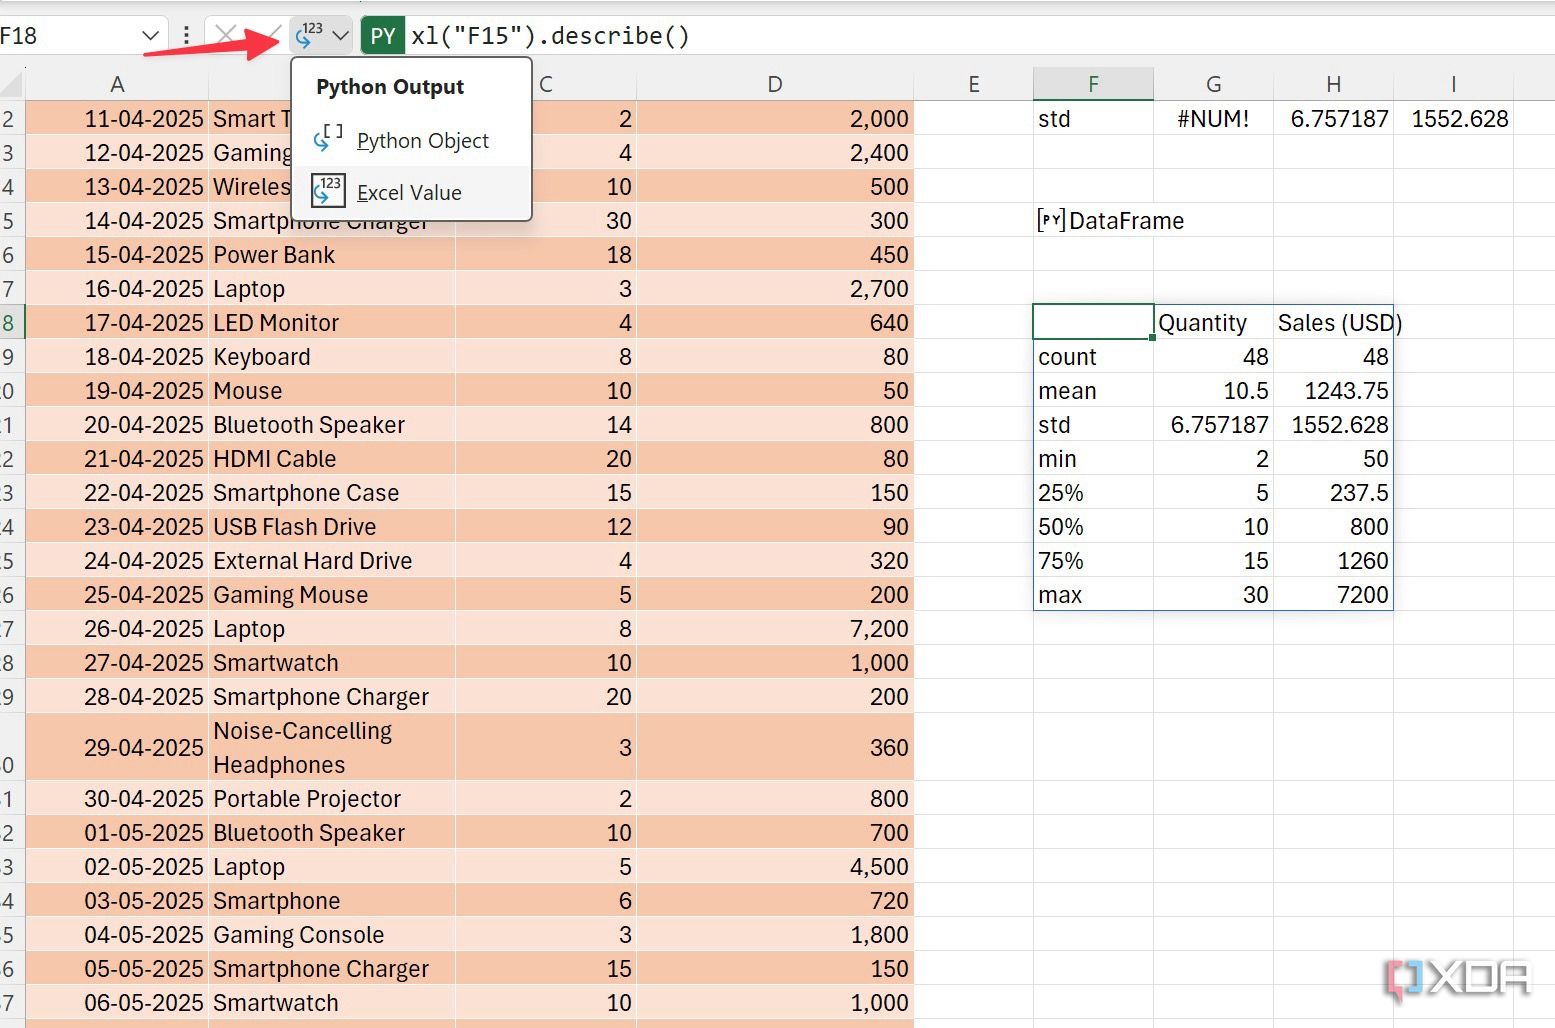
- Select your DataFrame cell to refer to it. Type .describe() at the end and press Ctrl + Enter.
-
The current result is a Python object. You can change it to an Excel value from the drop-down menu at the top.
-
It gives you a quick overview of your Excel table. Check the screenshot below.
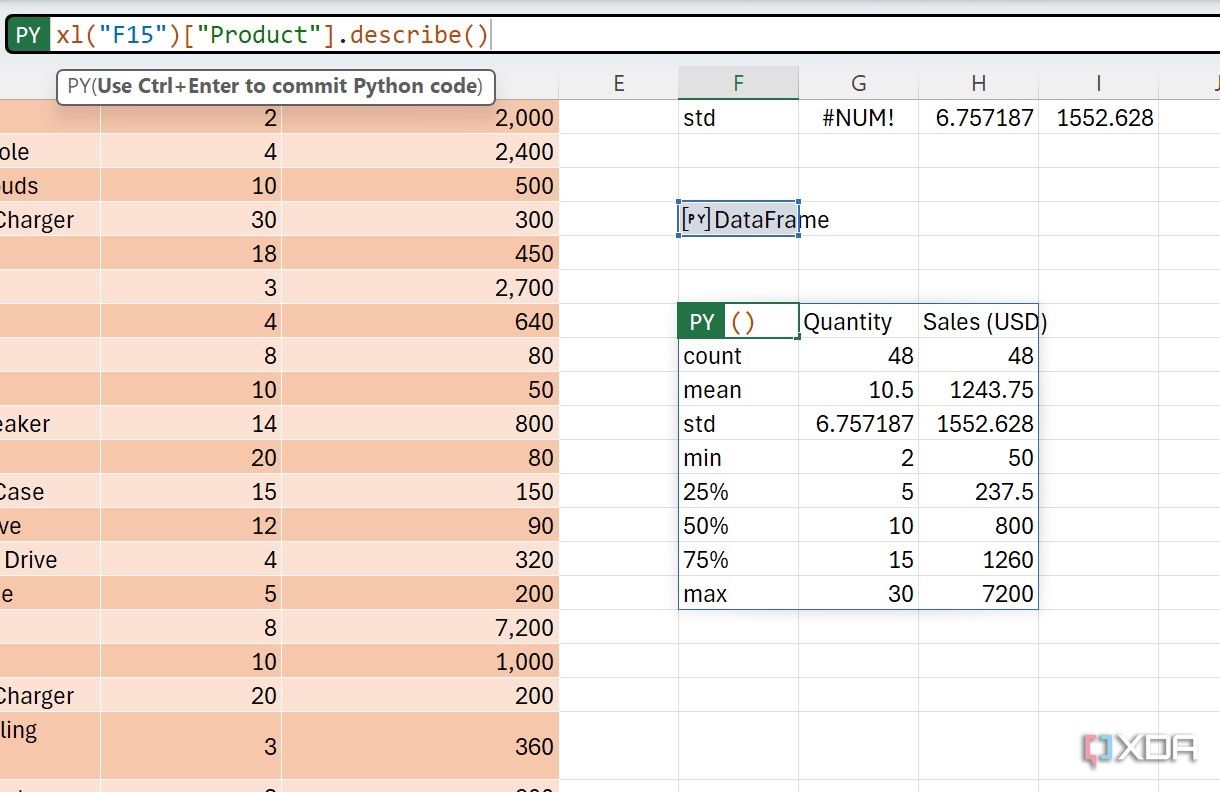
- Suppose I want to learn more about the Electronics Product column. I can refer to it in a Python script and check the result.
-
I need to add [“Electronics Product”] and press Ctrl + Enter.
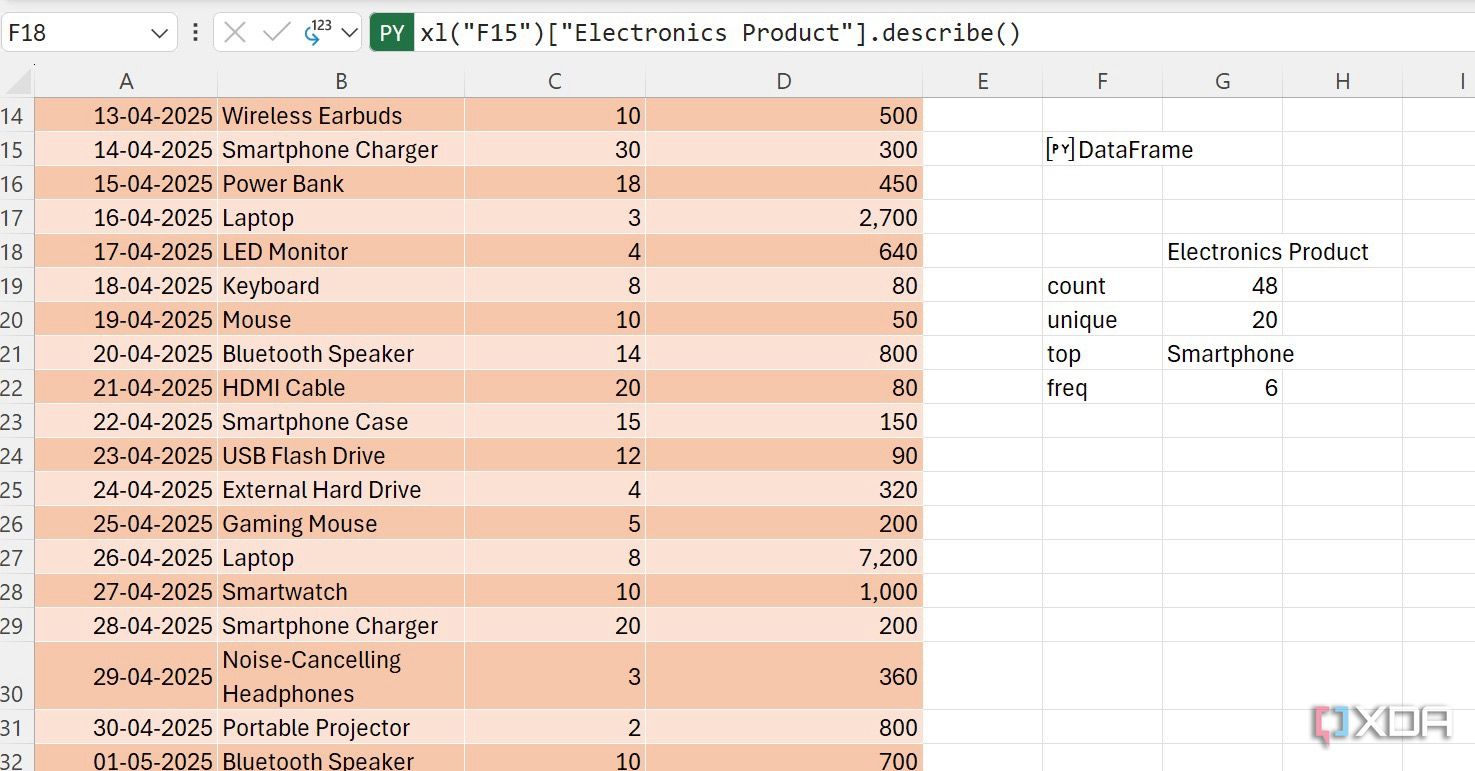


Excel shows the number of products, unique ones, the top product, and its frequency.
If you use Python in Excel frequently, you should add a reference to your DataFrame. That way, you don’t need to select the DataFrame every time. Select your DataFrame. Type any name (without space), add = and press Ctrl + Enter. I have given it sales name using the script below.
sales = xl("Table1[[#All],[Electronics Product]:[Sales (USD)]]", headers=True)

Now, suppose you want to group sales by date here. You can run the Python script below to create a database.
sales.groupby("Date").Sales.sum()

When you change any value in the main database, Python automatically refreshes the output accordingly. You can also insert different charts into your database. For example, the script below will add a line chart to your spreadsheet.
sales.plot(x="Electronics Product",y=Sales,kind="line")


VBA vs. Python: Which is the best tool for Excel automation
Understanding the future of Excel automation
Run queries in Python
You can even go ahead and run different queries using Python in Excel. For example, if you are running an e-commerce business and want to filter high-value products based on colors to anticipate their demand, you can easily do so using Python. You can run the script below to generate a database that contains Date, Product, Quantity, and Sales columns matching your queries.
sales.query('Sales > 1000 and Product.str.contains("Red")', engine="python")
By sales, I’m referring to the DataFrame.
What else can Python do in Excel?
I haven’t even scratched the surface with Python integration in Excel. As of now, I’m only using pandas for data analysis. In the future, I plan to explore NumPy and SciPy for advanced calculations and Matplotlib and Seaborn to generate a variety of visualizations with greater control over aesthetics and details than standard Excel charts.
The idea is to break free from limitations of built-in Excel features, leverage the vast ecosystem of Python libraries, perform sophisticated analysis, and automate repetitive tasks. Check out my dedicated post to learn more.
Enjoy Python-powered data analysis in Excel
Python in Excel has been a game-changer for me. It unlocks advanced data analysis, from complex statistical tasks to creating more insightful visuals, all without having to leave Excel. Of course, you can always perform many of these actions using the default tools, but if you enjoy the flexibility of Python, give it a try in your favorite spreadsheet tool.
Go ahead, experiment with the techniques discussed, explore the available libraries, review the official documentation to learn more tricks, and supercharge your data analysis endeavors in no time.


